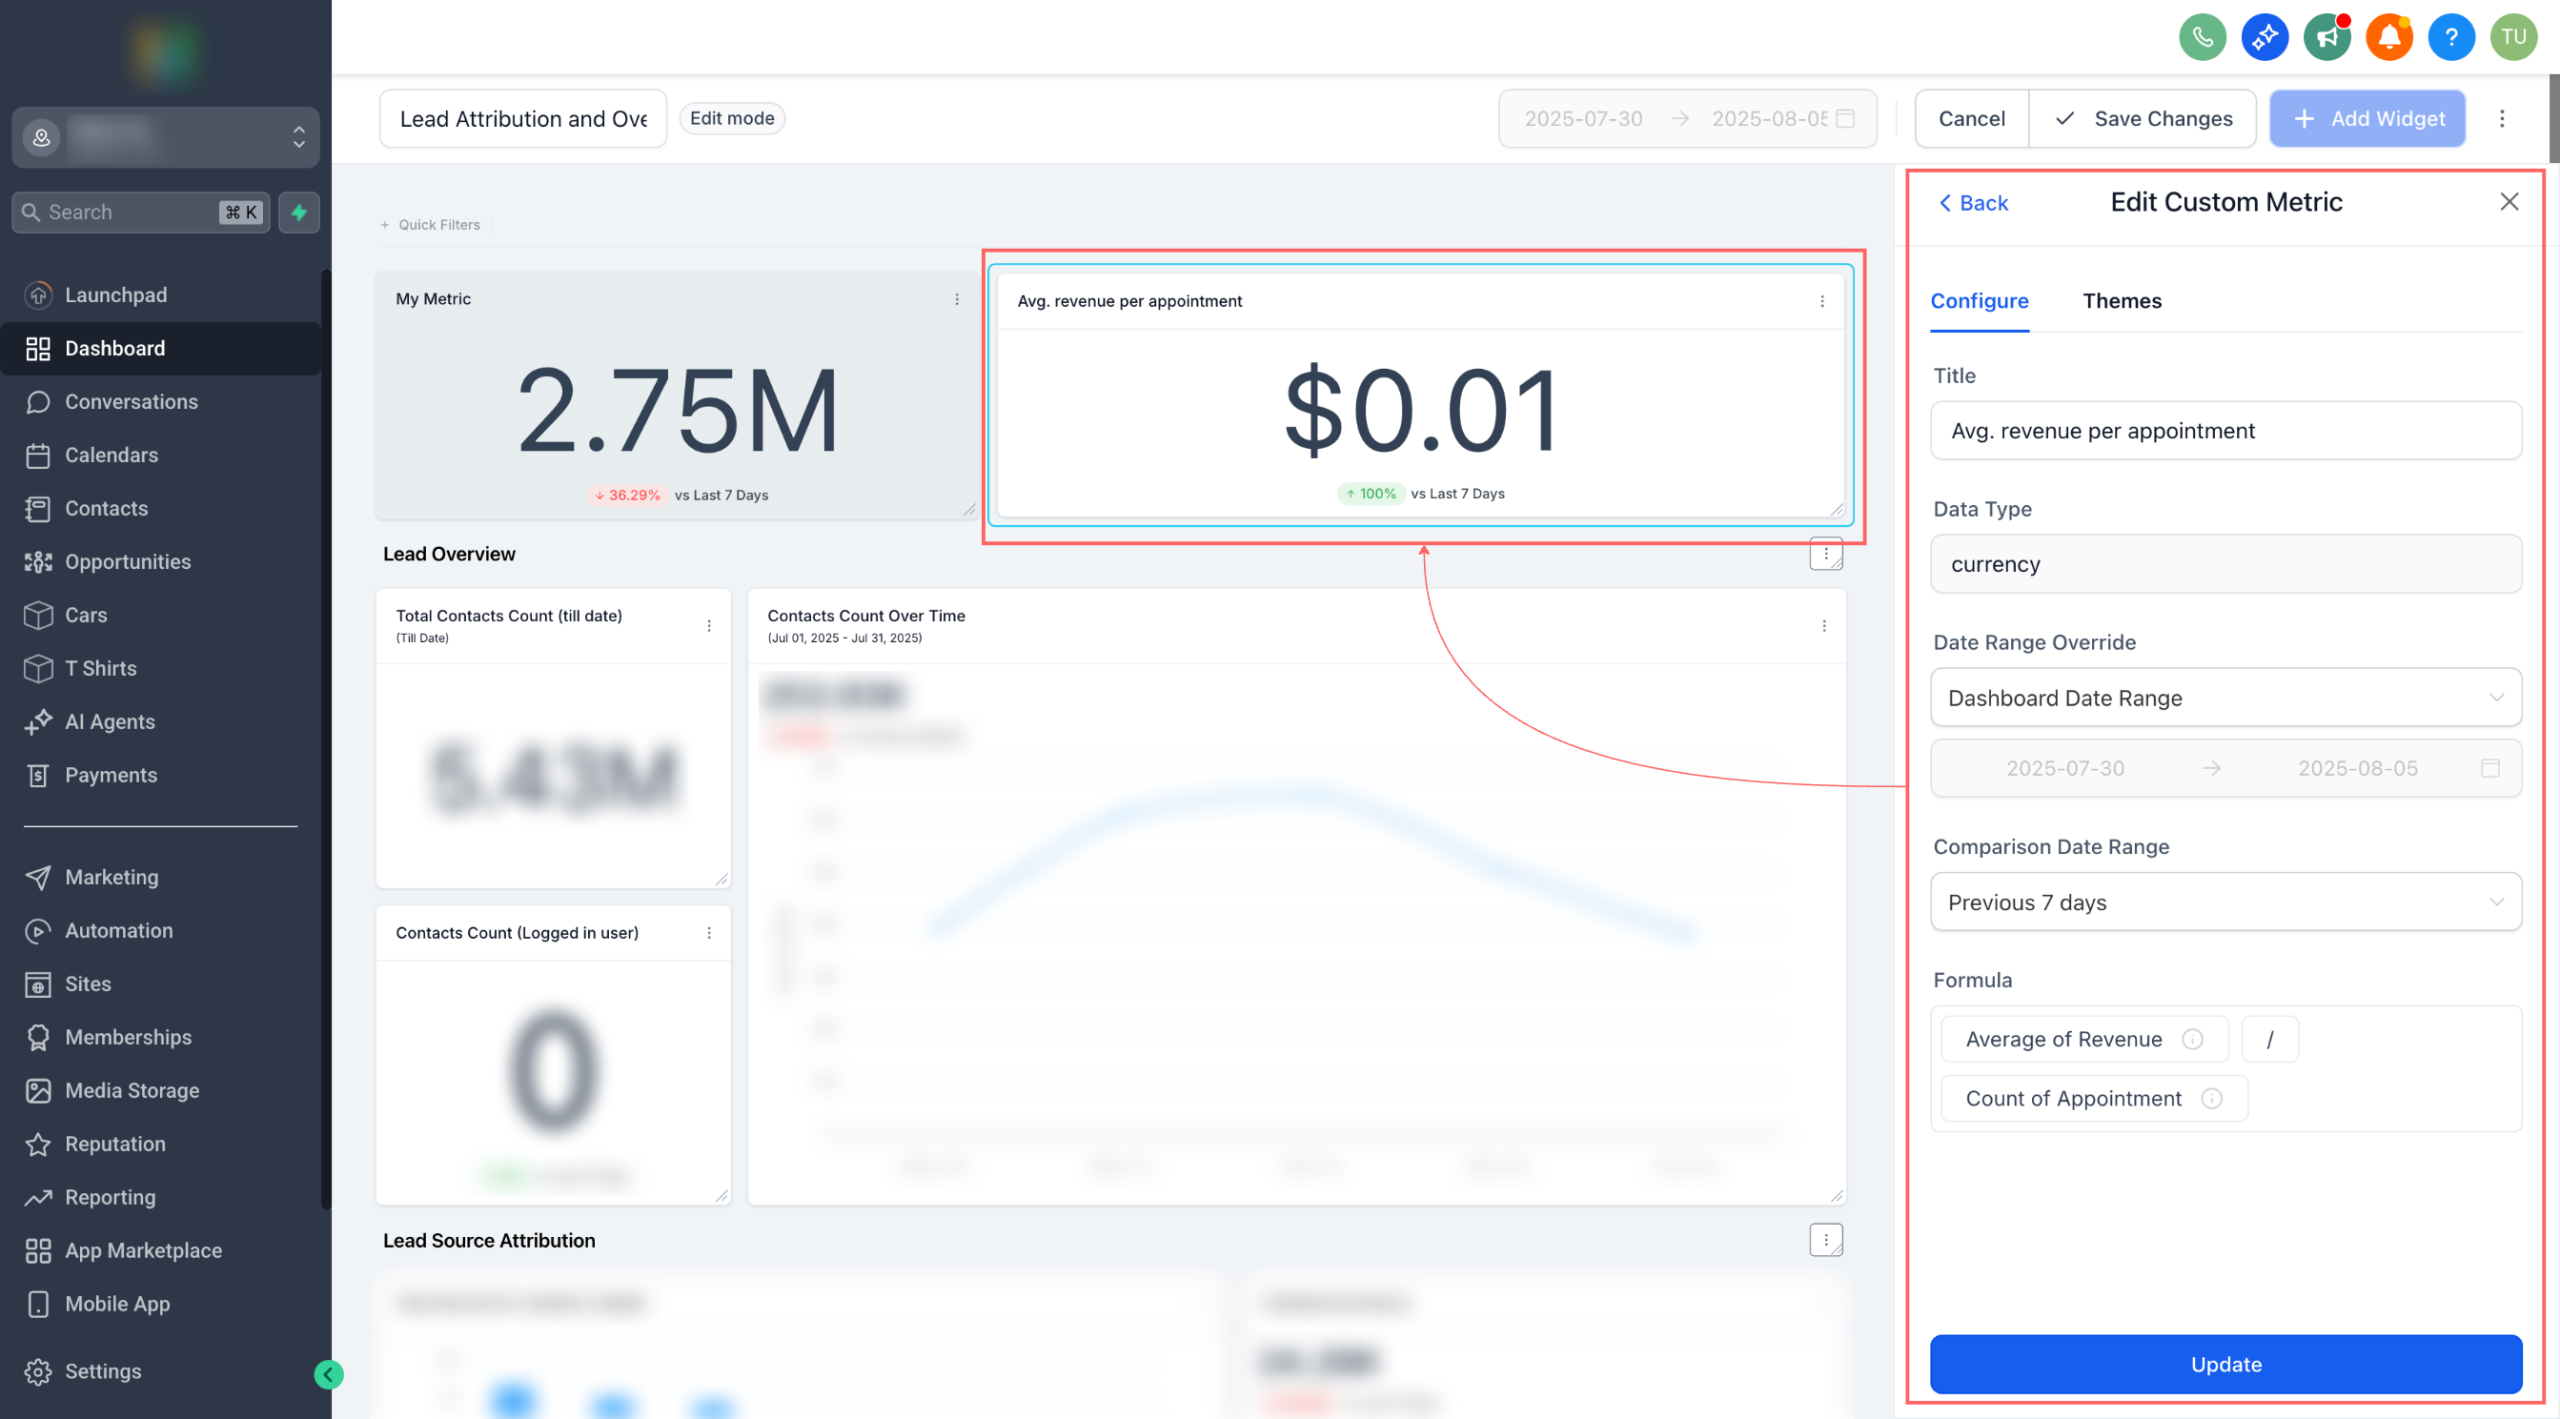
Build the KPIs you actually care about. Custom Metrics let you combine numbers from across your data sources, run calculations, and drop the result straight into dashboards and reports.
👀 What’s New?
– Create custom KPIs by mixing metrics from multiple sources (e.g., contacts, opportunities ).
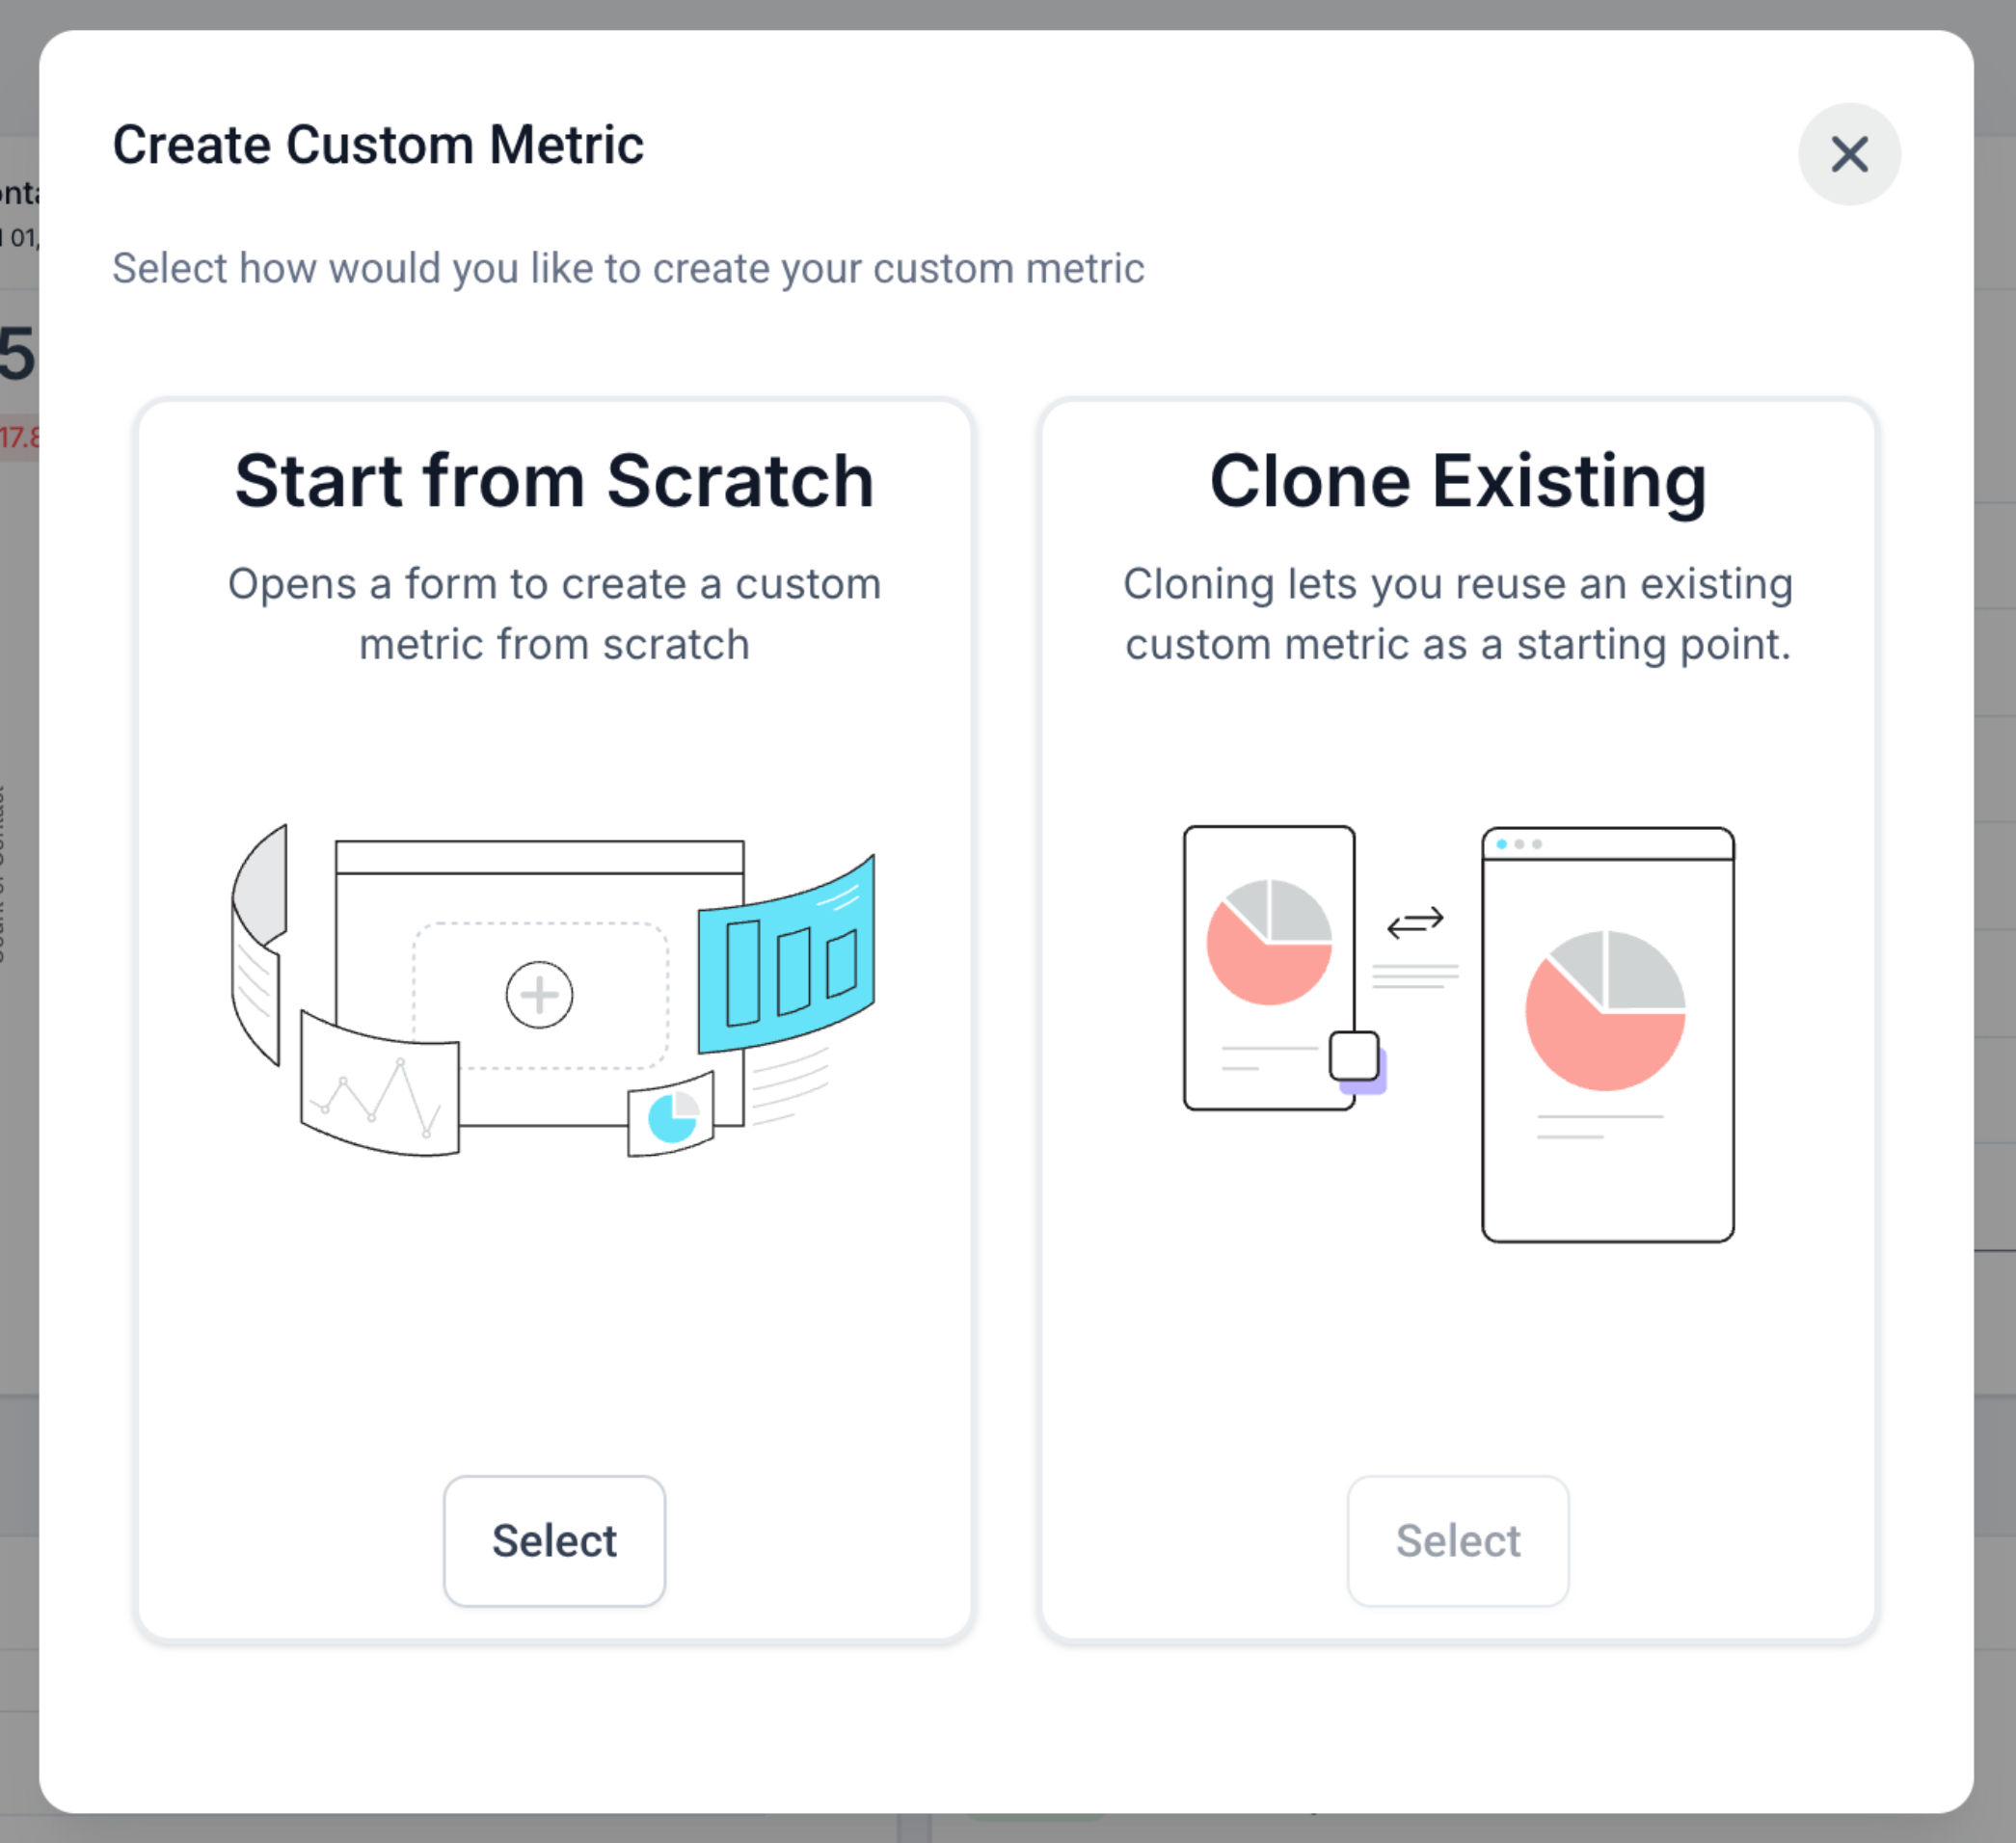
– Two ways to start: build from scratch or clone an existing metric.
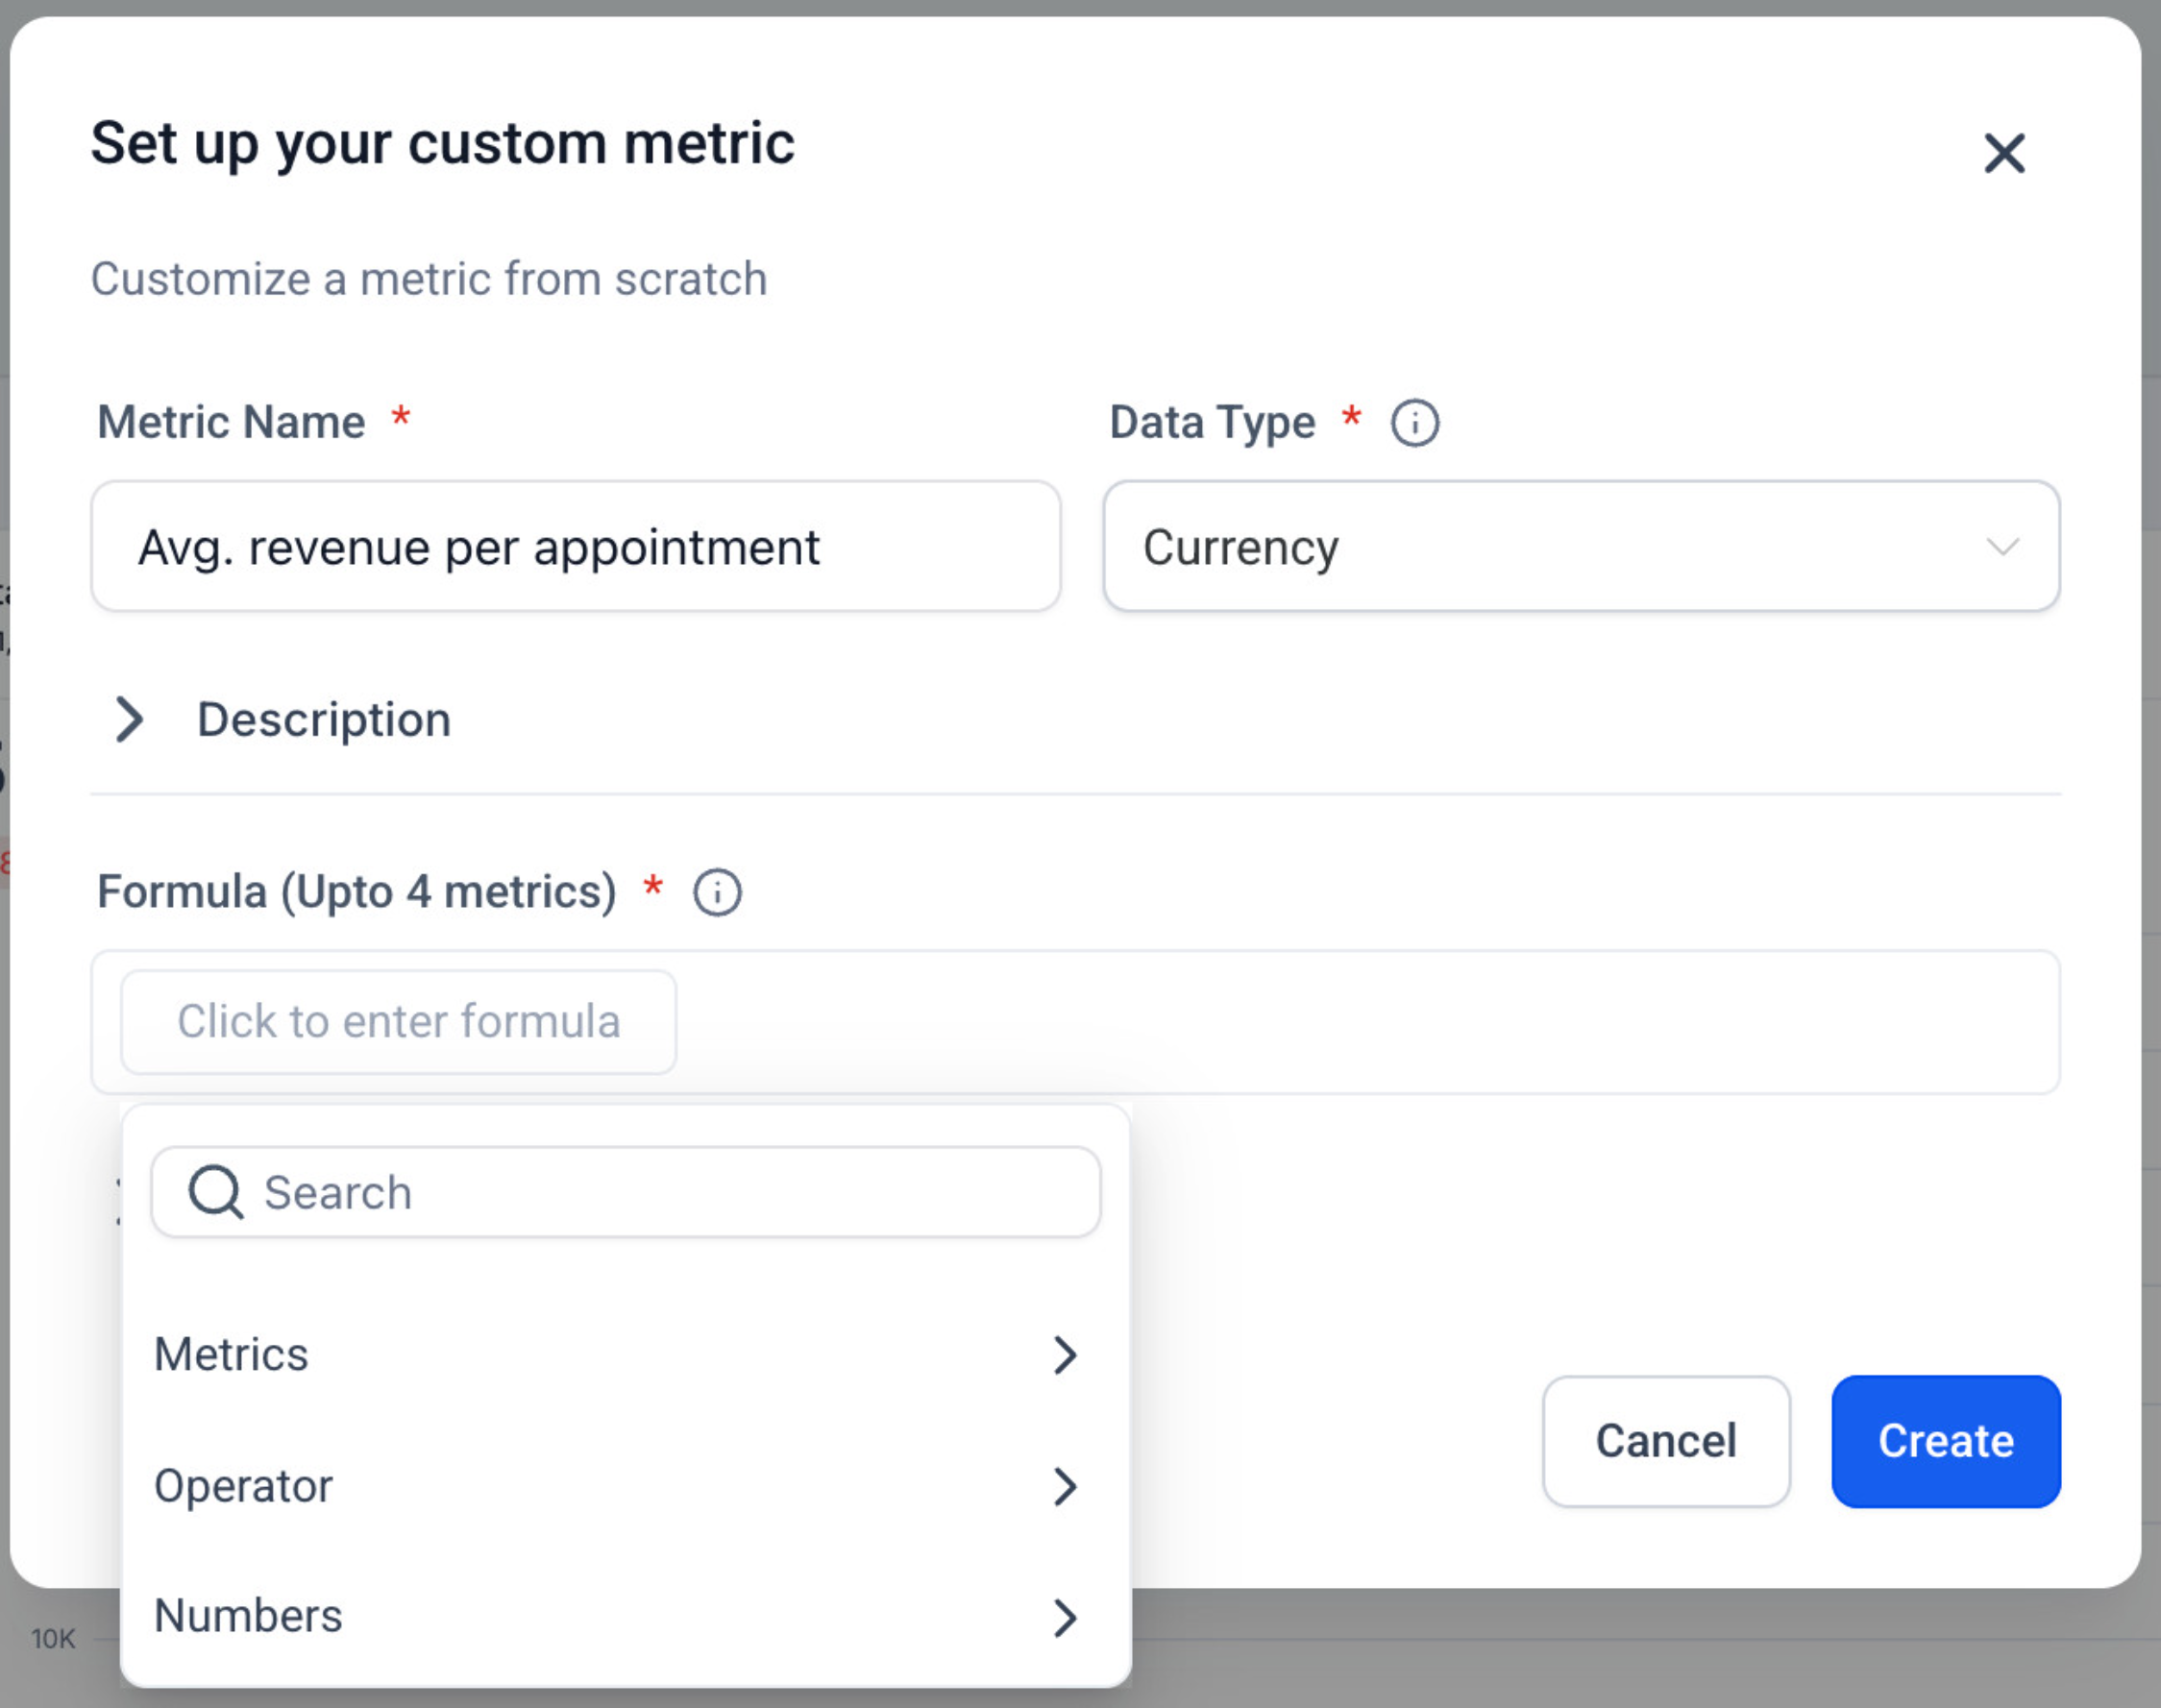
– Smart formula editor with live validation, operators, and numeric constants.
– Display types: Integer, Float, Currency, or Percentage
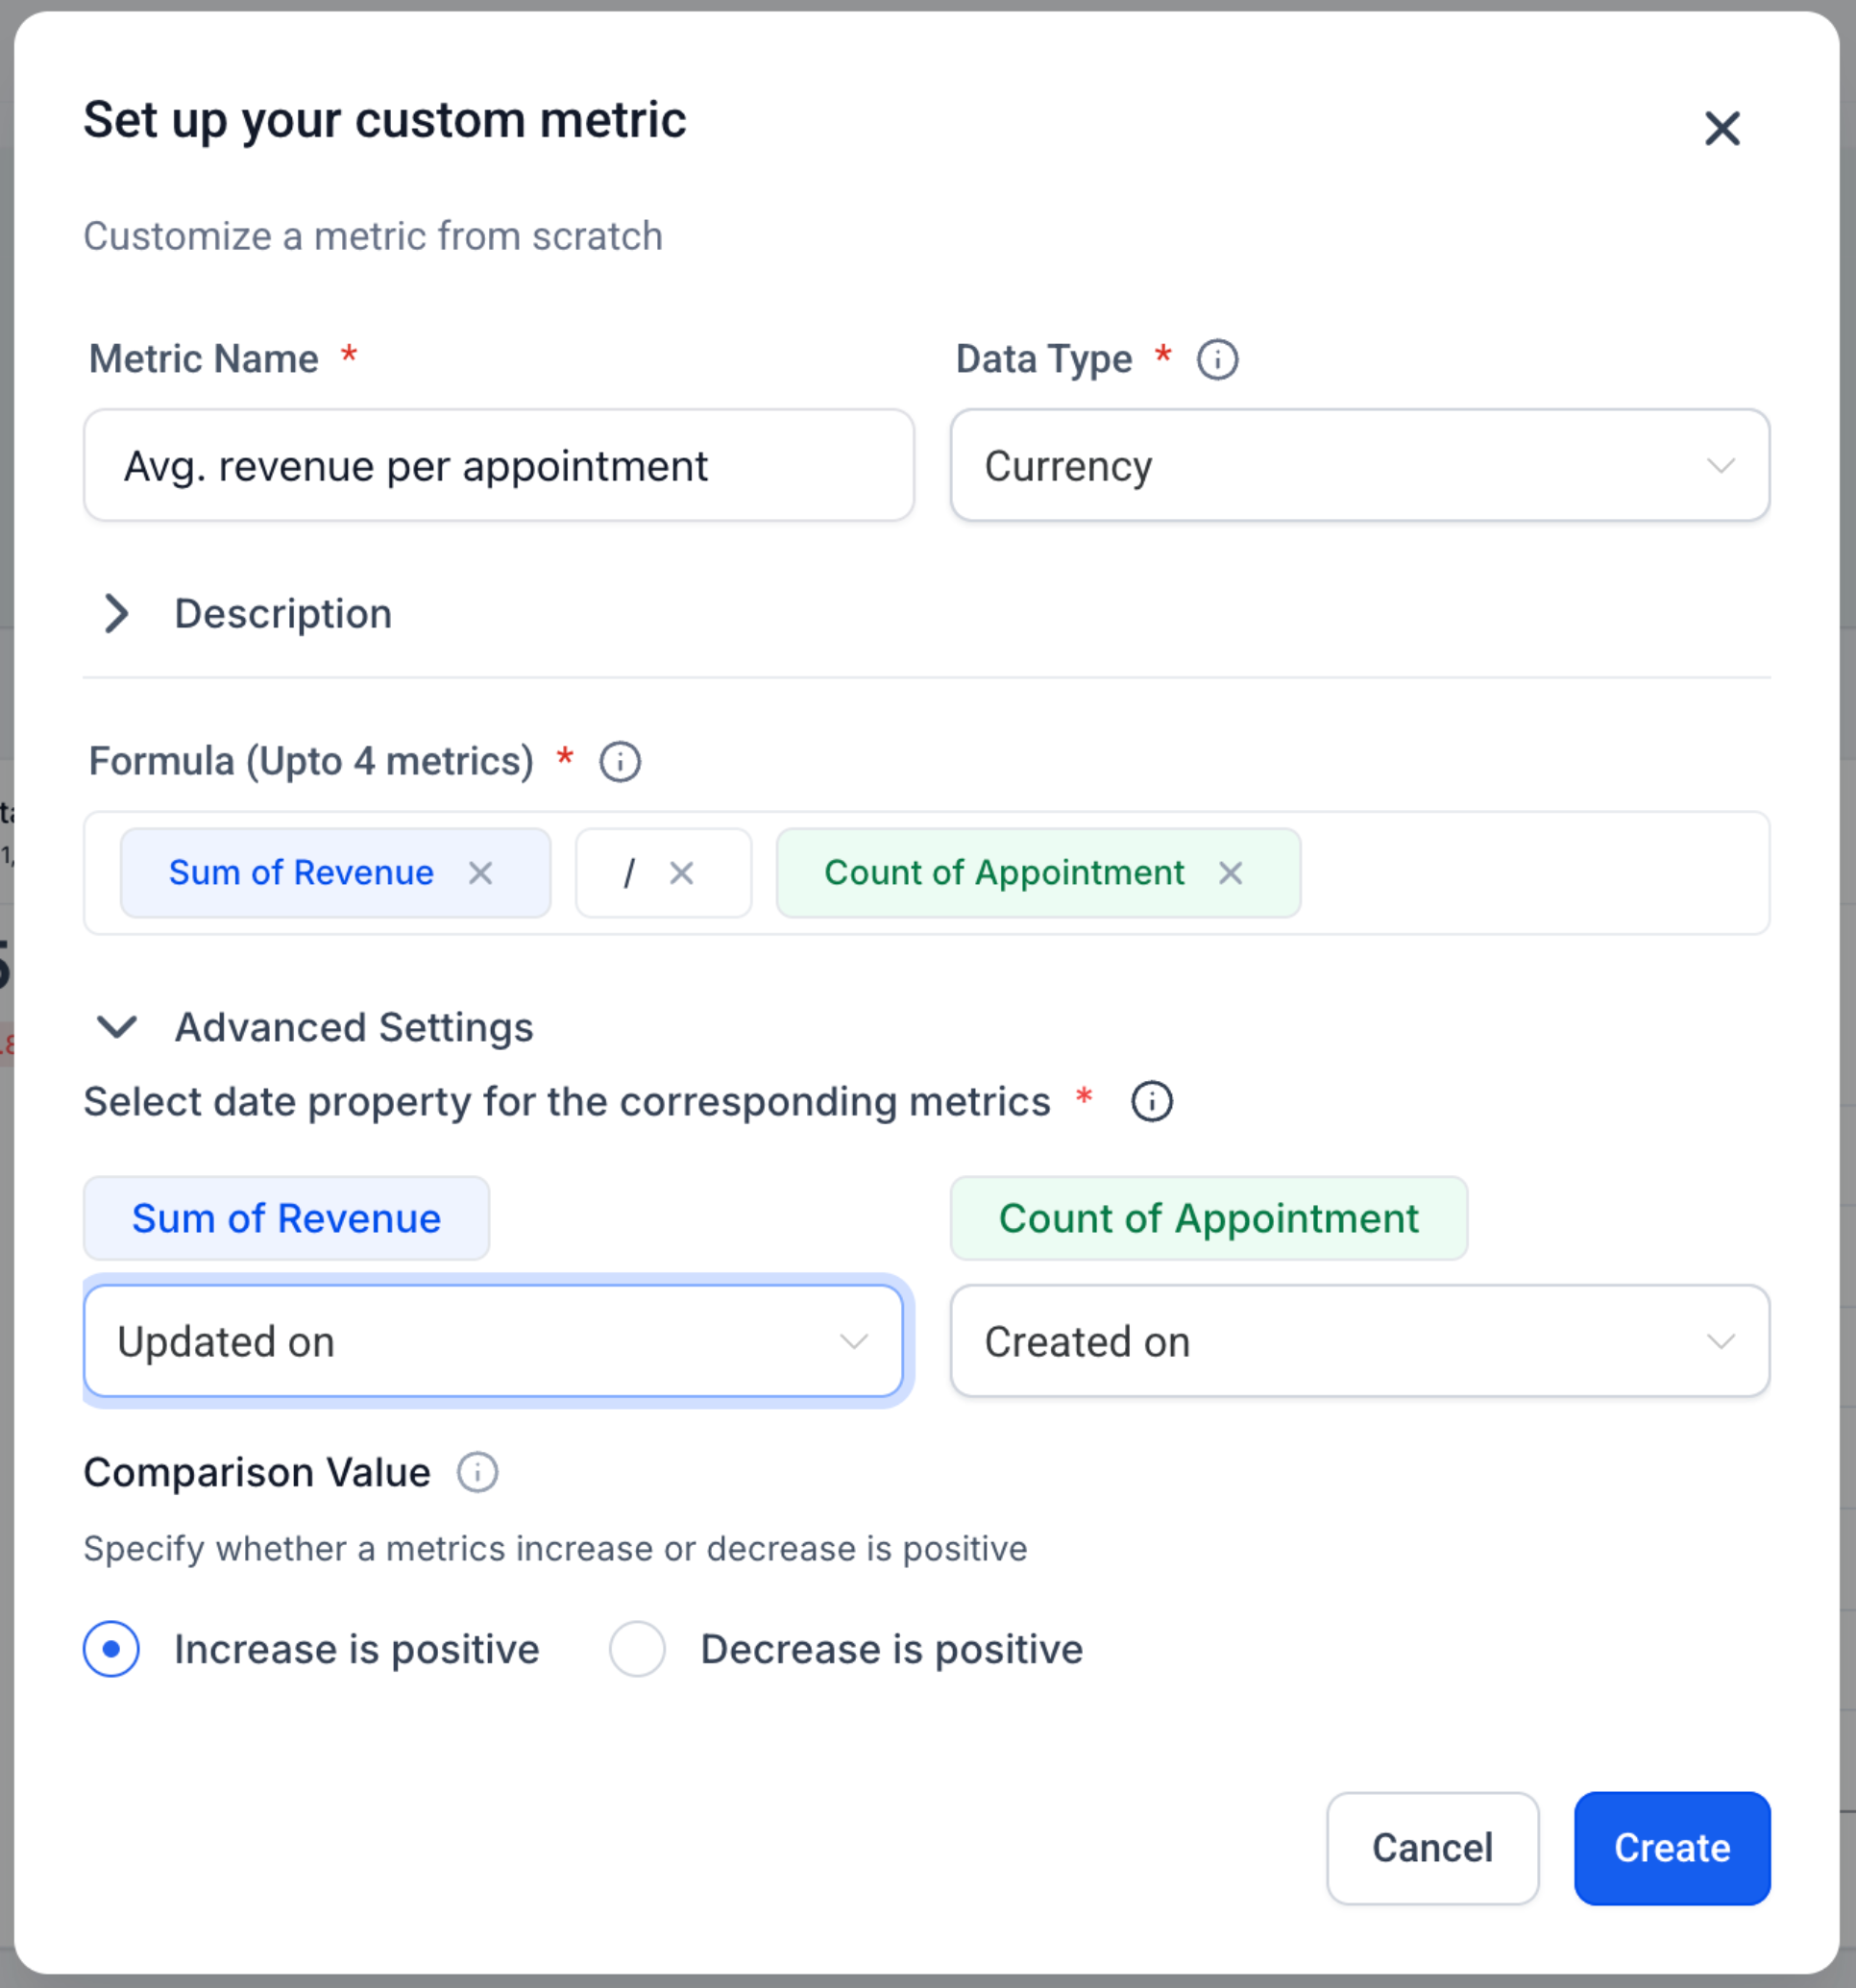
– Trend direction control: mark increases as positive or negative for that metric.
– Works everywhere: add as a widget to Dashboards and Custom Reports; Snapshots supported.
– Chart options: rename, theme, and (optional) compare to previous period before saving.
👷 How It Works:
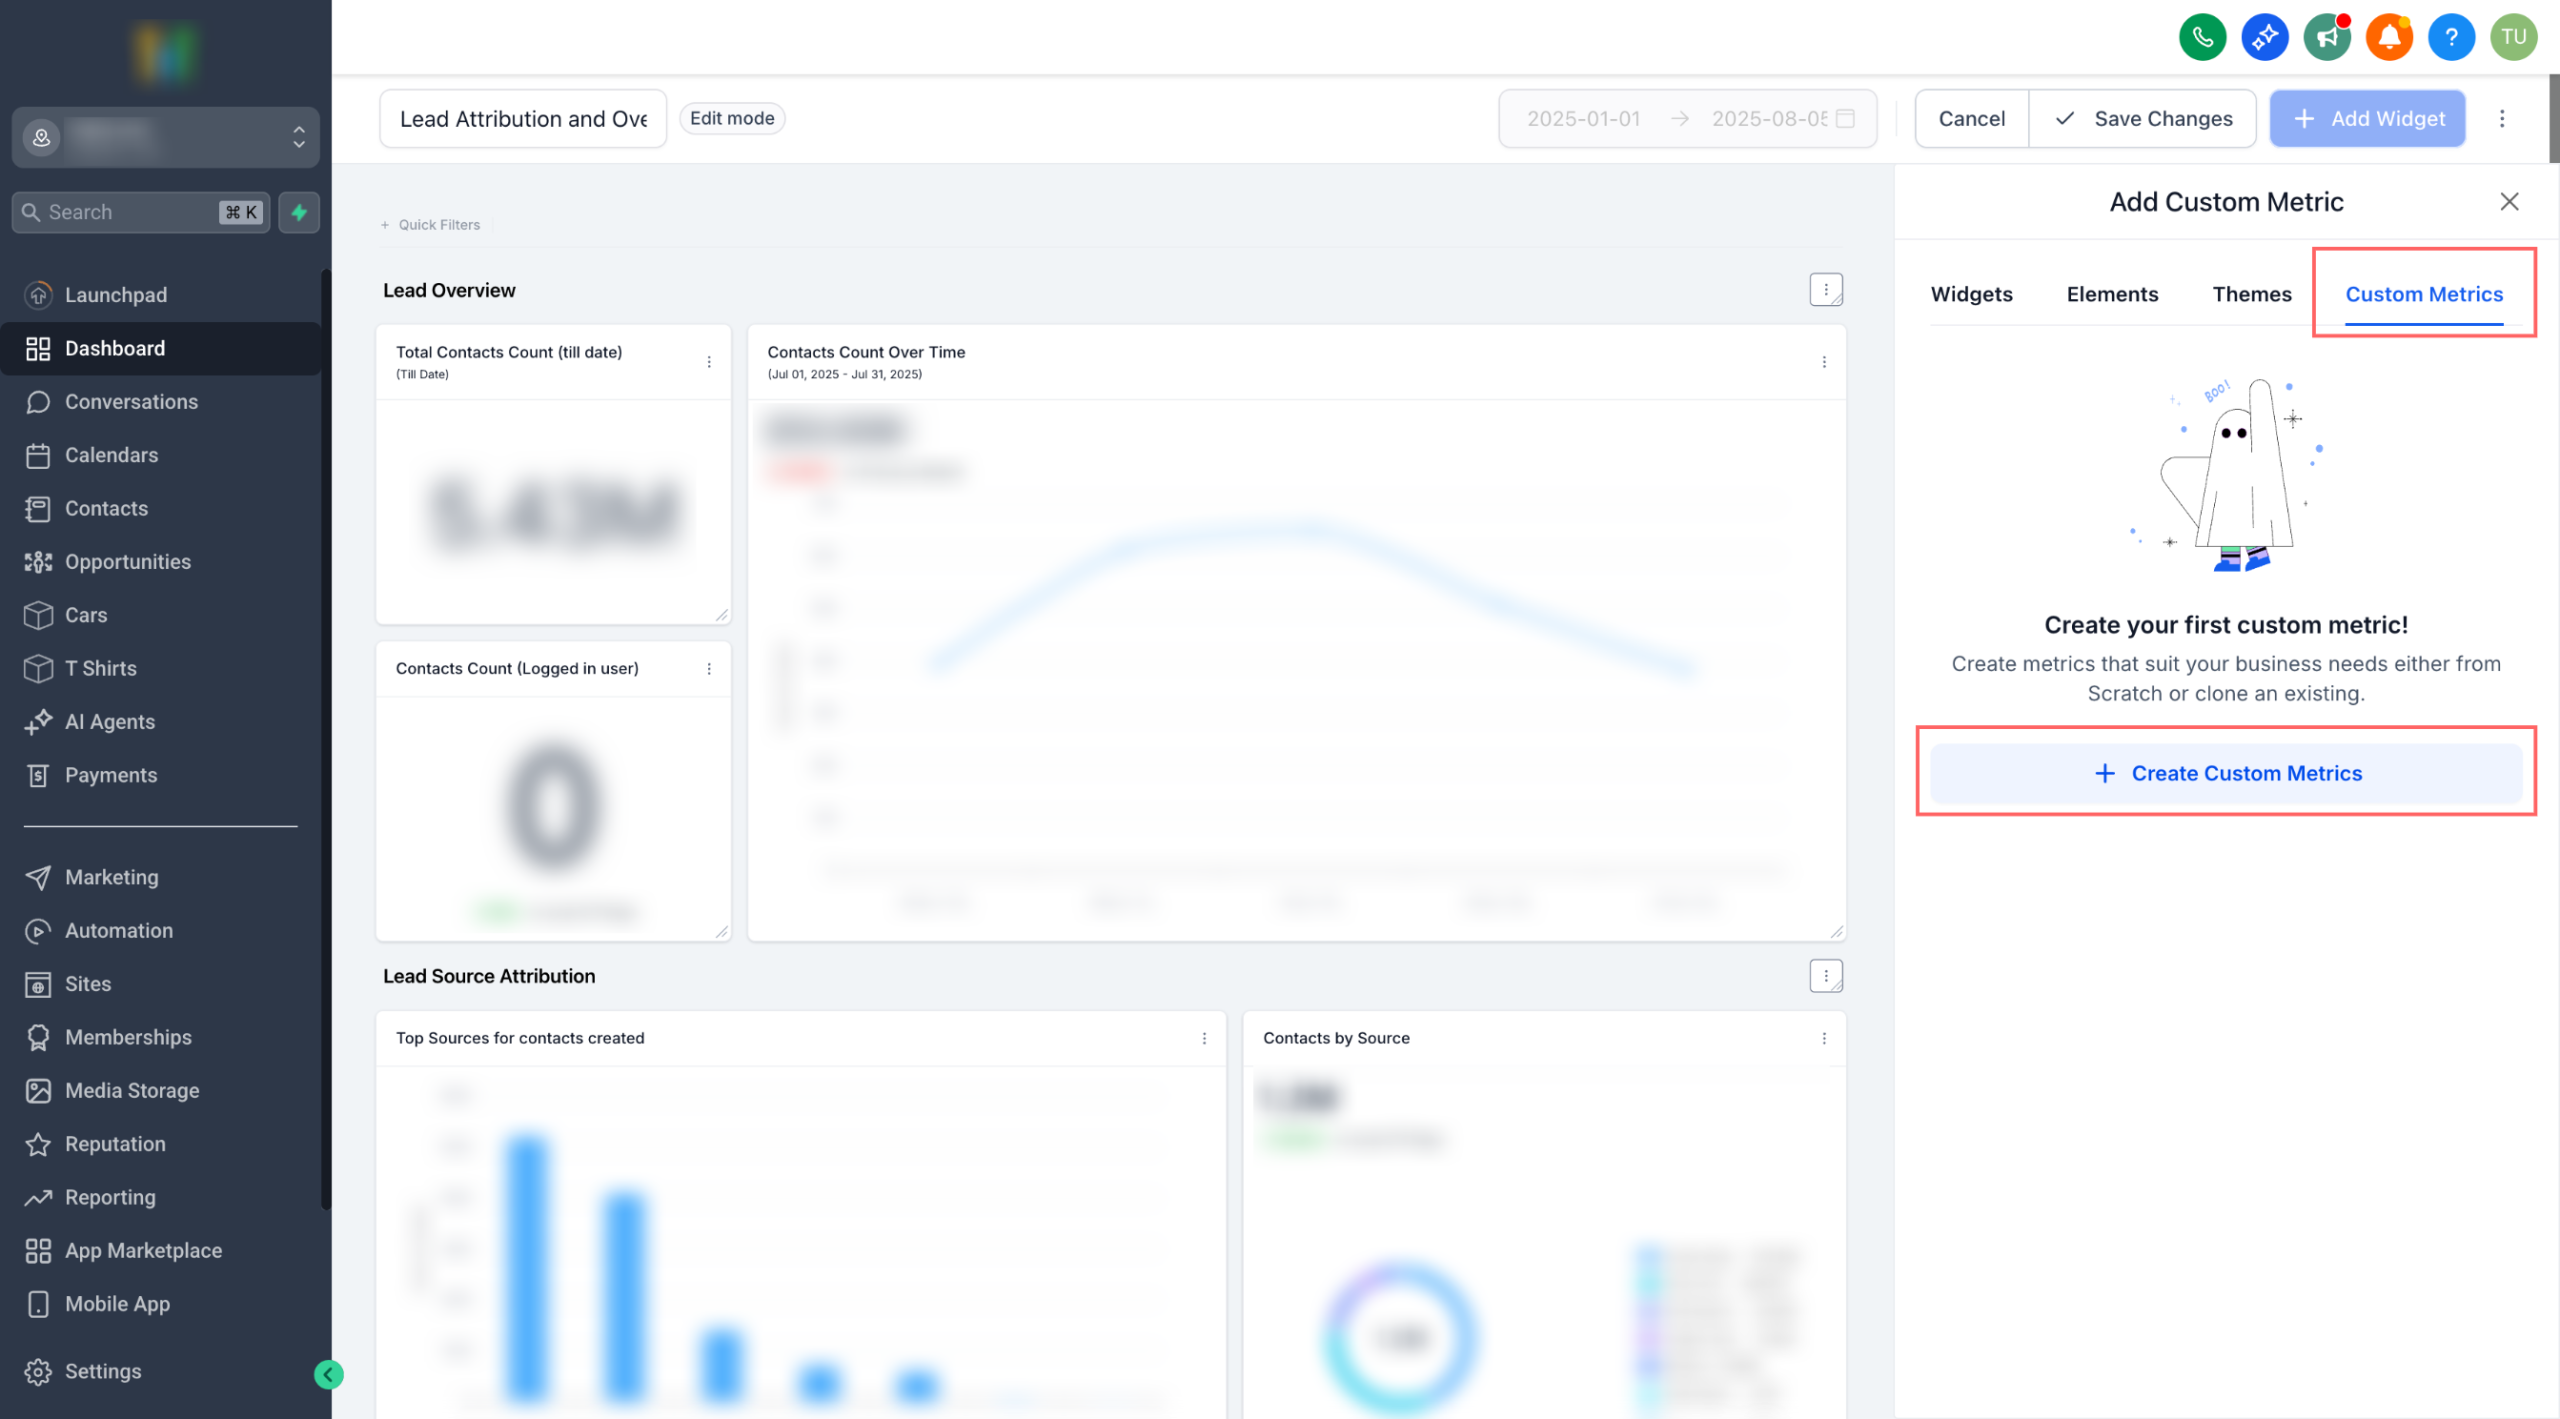
1. Go to a Dashboard (or Custom Report) → Edit → Add widget → Custom metric tab.
2. Click Create Custom Metric → pick From scratch or Clone.
3. Fill in Name, Data Type, Description, and Trend direction.
4. In Formula, type to insert metrics (choose data source + metric), add operators and numbers.
5. Create → select your new metric as a widget → configure chart → Save.
⭐ Why it Matters:
No more cobbling together spreadsheets just to answer “Are we growing efficiently?” Custom Metrics pull cross-tool signals into a single KPI, so teams can align on the exact definitions that drive the business.
⏭️ What’s Next
Metric-level filters & properties in the formula. Example: Count of contacts (WHERE Tag = “VIP”) / Count of contacts(WHERE Source = “Ads”).