We’ve redesigned the filter experience to make it more powerful and intuitive. Along with a new look, you’ll notice smarter behavior and more flexibility when setting conditions on your widgets.
👀 What’s New?
– Fresh UI: Sleek, modern layout with better use of space.
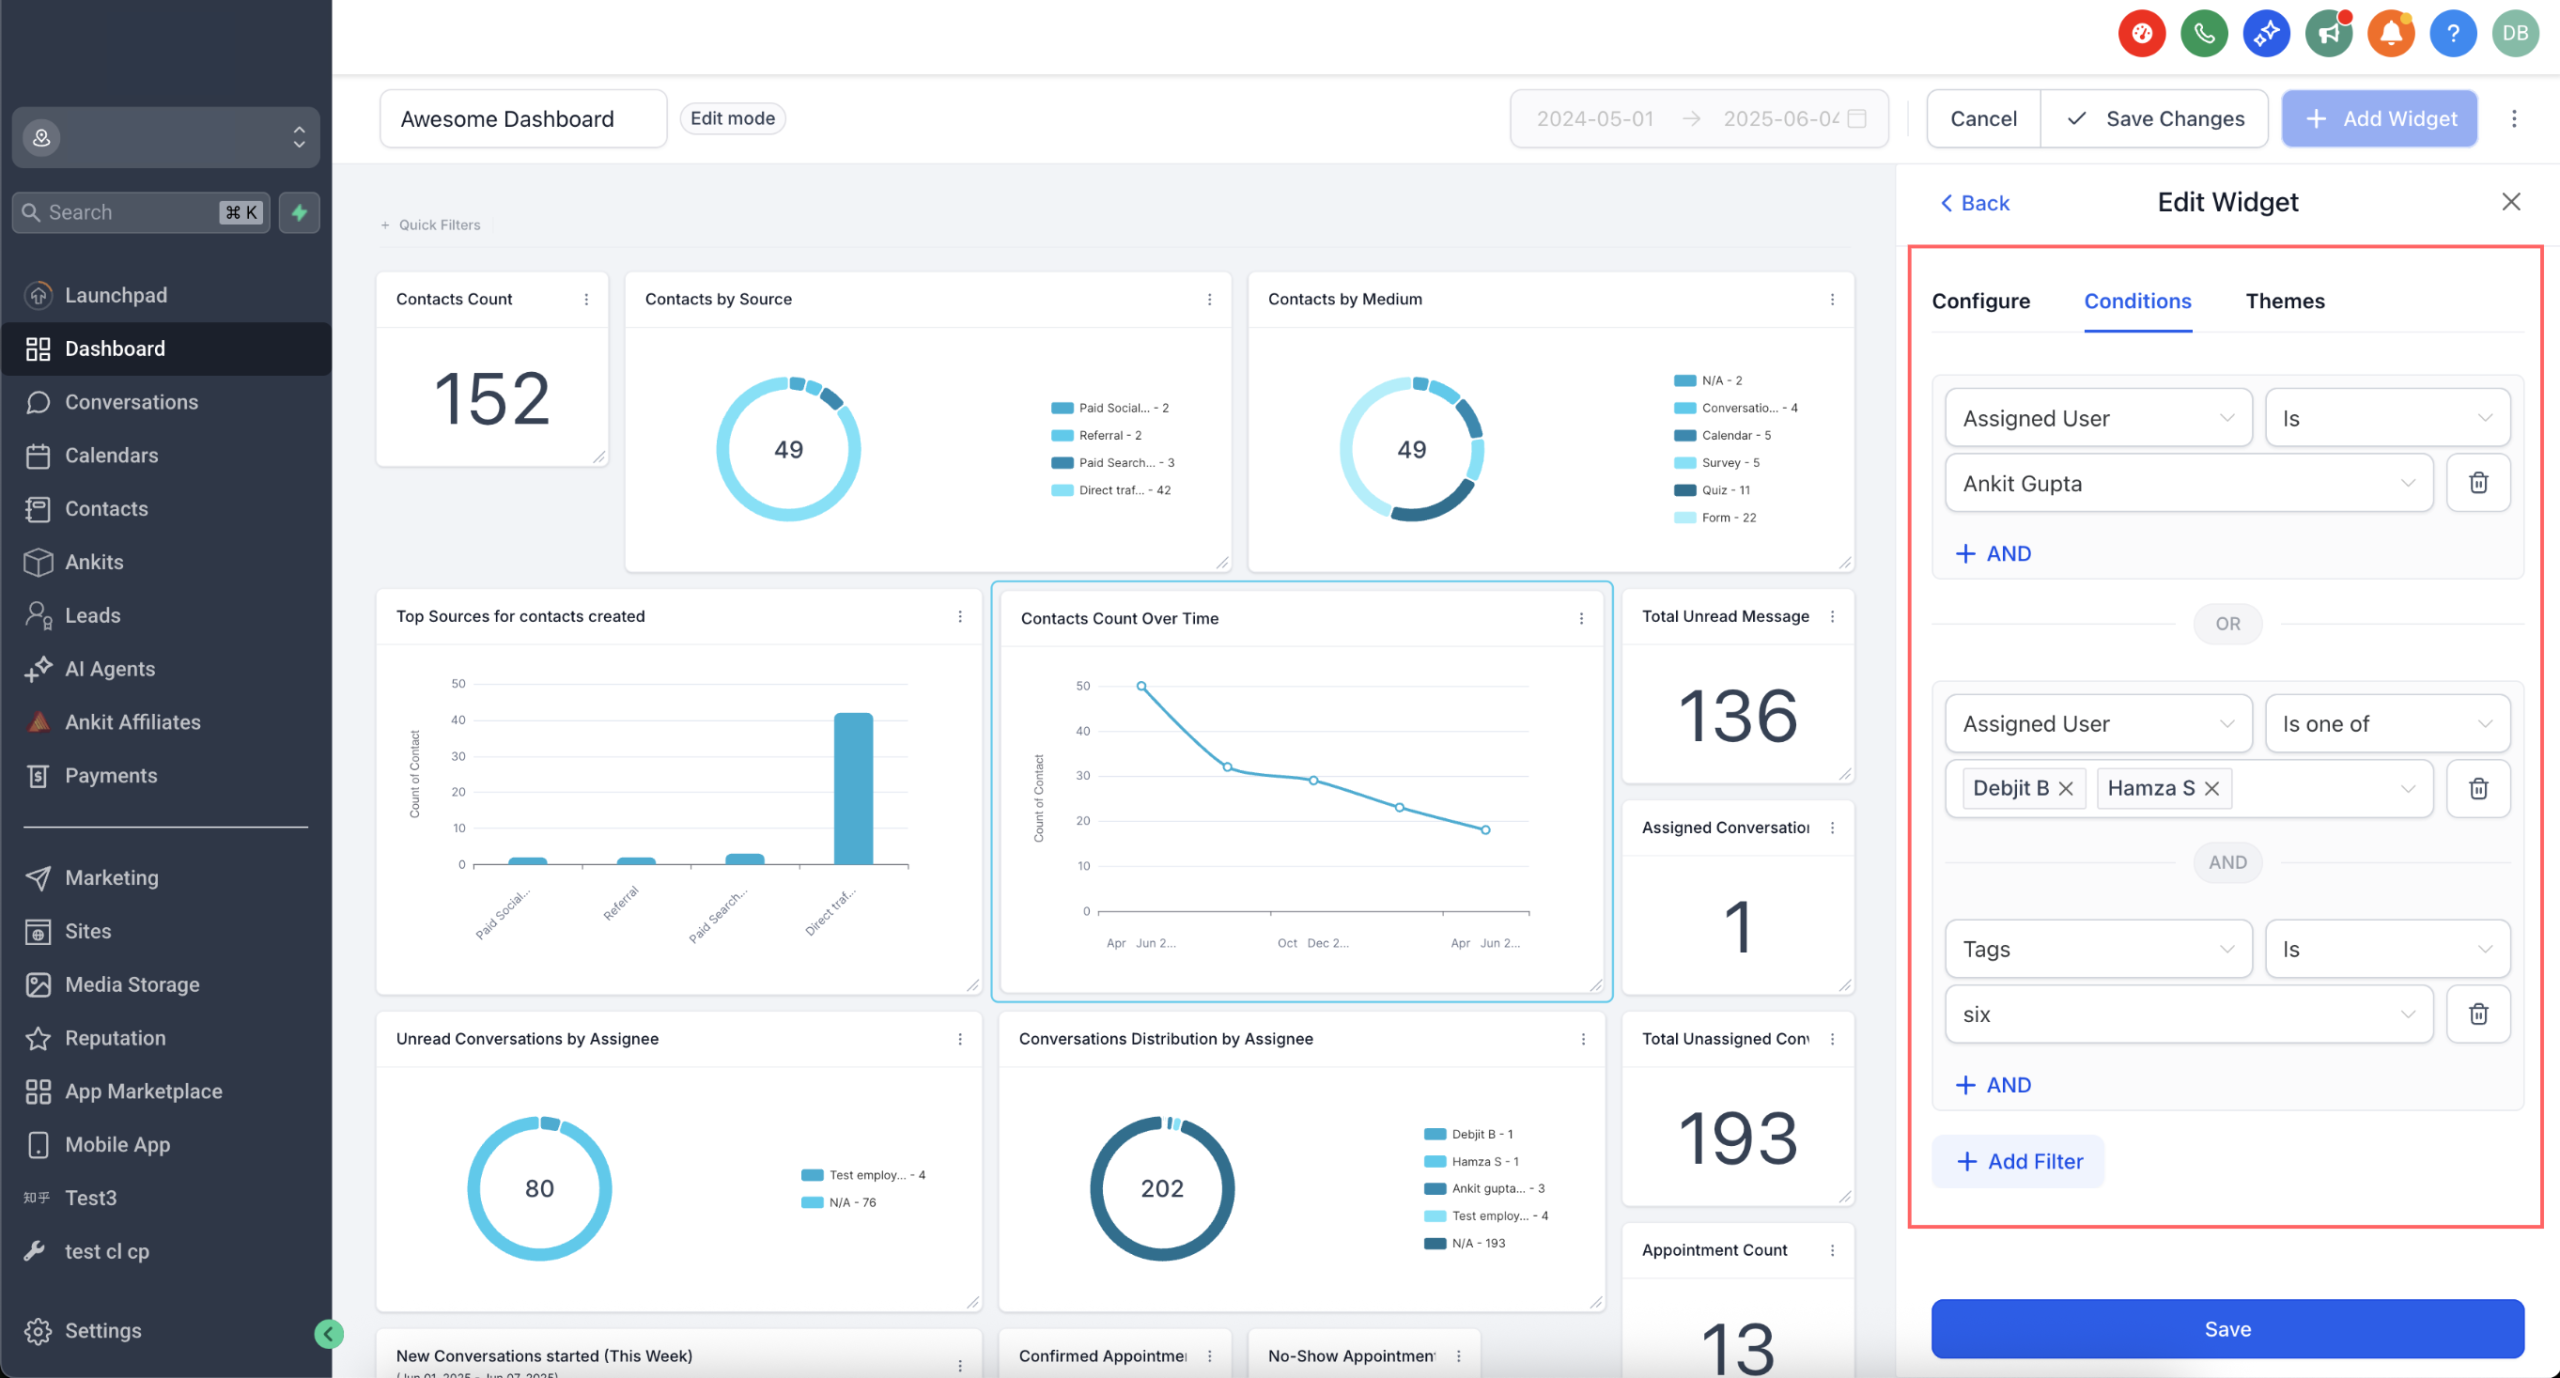
– Nested Filter Groups: Create multiple filter groups using OR conditions.
– Duplicate Filters Allowed: Previously, the same filter couldn’t be used more than once — now it’s possible through nested groups.
– Smarter Warnings: Clear messages when filters are linked (e.g., pipeline and stage).
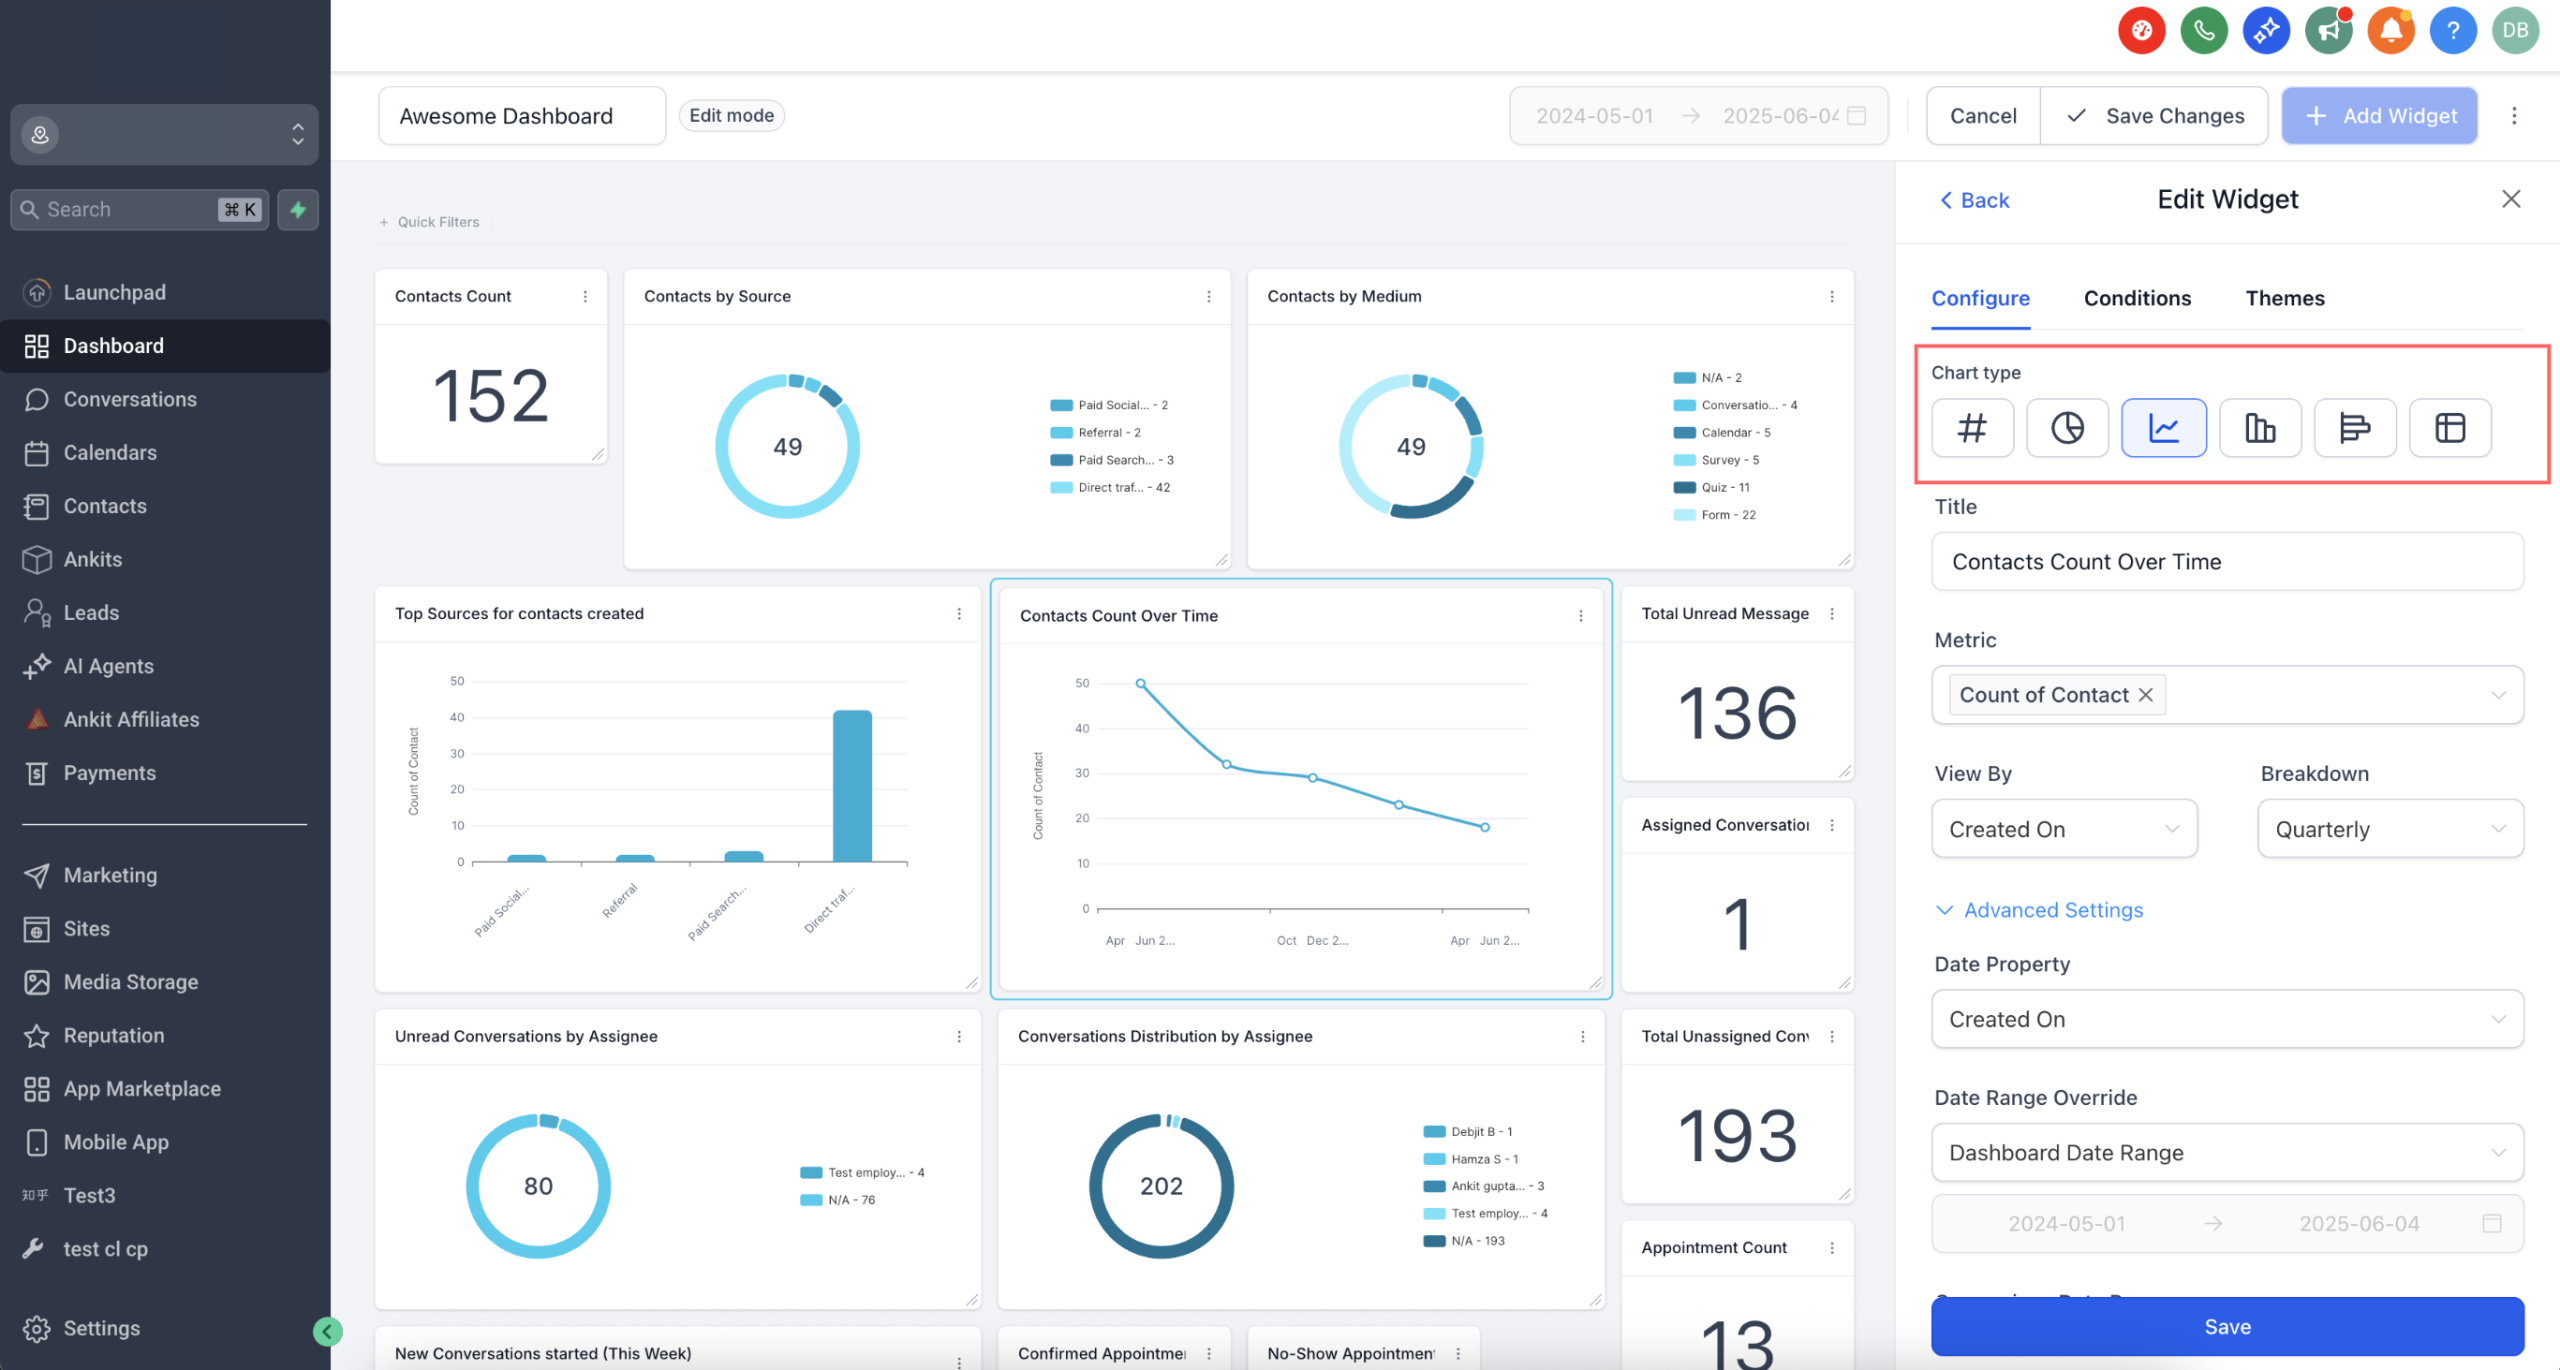
– Chart Type Picker: Choose chart type right from widget settings.
– Redesigned Sidebar: Slimmer layout gives more room for live dashboard preview.
– Same Experience in Custom Reports : This new filter interface is also being rolled out to Custom Reports, so you get the same flexibility and improved UX across both widgets and reports.
👷 How It Works:
1. Go to Dashboards and click Edit Dashboard,or go to Custom Reports and Edit a Report
2. Click Add Widget and select your widget.
3. In the Configure tab, pick a chart type if needed.
4. Switch to the Conditions tab to apply filters.
5. Click Add Filter to create your first group.
6. Use +AND to add more filters to the same group.
7. Click +Add Filter again to create a new group (this adds an OR condition).
8. Click Save.
⚠️ Please Note:
– Visitor Data Widgets support only one filter group.